Golden Hurristats: A Spartan Recap
By: Matt Rechtien
Date: 09/13/2019
Welcome to the first edition of The Golden Hurristats! This is a weekly column where I’ll focus on some stats that I think are having an impact on Tulsa’s football season.
The first two weeks of college football are over and the Golden Hurricane sit at 1–1, a record that I imagine all but the most optimistic (or pessimistic for that matter) were expecting after back-to-back games against the Spartans. With roughly one-sixth of the season over—roughly because it will be thirteen games not twelve when Tulsa makes a bowl game—it seems like a great time to look at some of the statistics that explain Tulsa’s season so far.
Just a note before we get started, two games is a very small sample size so results may vary going forward. With that said, let’s dive in.
Three Key Factors
If you listened to our season preview (36:35) episode before the Michigan State game you may remember that Pat, Ryan and I each picked a stat that we think will be the key to our success or lack thereof this season. If you forgot, or didn’t get a chance to listen here’s a refresher:
- Pat: Yards Per Passing Attempt. (YDs / Att) Zach Smith is strong on the deep ball, so him throwing deep more often than we did last year is essential to our success.
- Ryan: Total Quarterback Rating. (QBR) 29.4 QBR rating last season, and our quarterback play is a big contributor to how our offense is rolling.
- Matt: Average Third Down Distance. We were shooting ourselves in the foot by not having successful first and second down plays, making it harder overall to convert and also taking away potential options for play-calling.
After the quarterback search that Tulsa went through after the 2016 season it might not be a surprise that these three are all connected how well Zach Smith plays. We at the Golden Hurricast have a lot of confidence in the skill of our football team and if the QB plays well then our view is that the overall success of the team will follow.
Let’s take a look at how these stats played out over the first two weeks.
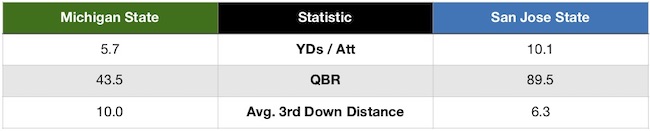
The stark contrast between these numbers shouldn’t come as a surprise if you watched these games. Tulsa was dominated by MSU’s top-ranked defense, but was a lot more successful at forcing their will against San Jose State. Zach Smith looked incredibly sharp against San Jose and was able to hit receivers anywhere on the field with great success. His performance made the entire offense stronger because it forced San Jose’s defense to spread out instead of stacking the box. This made it easier for the Shamari Brooks and TK Wilkerson to find open running lanes and they took advantage of the opportunity.
My belief is that going forward these stats will be closer to San Jose State than Michigan State. Our offense found the identity that works for it against San Jose State, and as long as Zach Smith and the offense can remain consistent I see it working for us through the season as well. The biggest concern, that I will address in the next section, is that our offensive line will need to improve its play because the defenses we play in the conference this year, while not Michigan State strong, are better than San Jose State’s.
Run Blocking
The offensive line has been the weakest part of our offense so far this season. Against Michigan State they struggled to generate both run and pass protection resulting in the “negative” 73 rushing yards that everyone and their neighbor loved mentioning for the entire week after the game.
They showed vast improvement against San Jose State, best seen by the the inncredible decrease in tackles for loss (TFL) and sacks. Against Michigan State they allowed 13 TFLs and 5 sacks. Against San Jose State they gave up only five TFLs and zero sacks.
It’s nice to see improvement, there is still room for more, particularly when it comes to run-blocking. Again, the line was markedly better in this regard against San Jose State than they were against Michigan State, reflected most obviously in the -73 vs 256 net rushing yards. No question that is great progress, but the raw numbers aren’t the whole story. Through two weeks of the season the offensive lines has struggled to generate open lanes and is putting more of the onus on the running backs. Let’s take a closer look.
Football Outsiders is one resource I use and has a lot of great stats for college football. It is without a doubt the best resource I’ve found to get statistical breakdowns of offensive line play. Using their data, I want to focus on four run-blocking stats in particular.
-
Line Yards – The number of yards that the offensive line can be credited with per carry. The line gets credited with 100-percent of yards for 0–3 yards, 50-percent for yards 4–8, and none for yards after 8 (max of six yards per carry). Lost yardage counts for 125-percent.
-
Opportunity Rate – The percentage of carries that get four yards (when four yards are available).
Stuff Rate – The percentage of carries that are stopped at or behind the line of scrimmage.
- Power Success Rate – The percentage of runs on third and fourth down, when you needed two or fewer yards, that resulted in either a first down or touchdown.
Through week two, here’s where Tulsa stands:
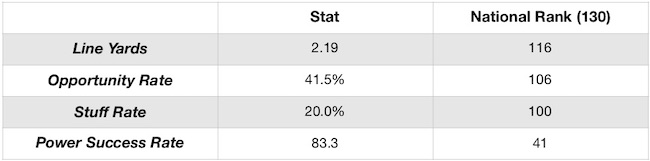
Even with our improved rushing game in the San Jose State game, our underlying run-blocking numbers are still in the bottom 25-percent nationally. Though I’m not able to isolate the week 1 numbers, I’m still confident that there was a big jump from week 1 to week 2, but that doesn’t mean there isn’t anything to be concerned about going forward. If we want to sustain the strong rushing game we put on display against San Jose State, then our offensive line is going to have to continue to trend up, and alleviate the pressure for Brooks, Wilkerson, and Corey Taylor to create their own rushing yards. Opening lanes up for the running backs will prevent them from getting worn down over the course of the season and keep our rushing game strong throughout the year.
It’s not all doom and gloom though. For one, the Power Success Rate was in the top third nationally and shows that as long as we can keep the distance short on 3rd or 4th down, then we have a strong chance to convert. And second, our offensive line is very young. Two linemen—Dante Bivens and Gerard Wheeler—made their first career starts against San Jose State! I believe that as this unit gets more experience and more confidence we will see the run blocking stats continue to improve and the offense will get even better than it is currently.
This breakdown is a small percentage of the stats behind Tulsa’s season so far, and I’m excited to get a chance to explore more as we march through the season.
Stay Golden!