Tulsa's QB Deja Vu
By: Matt Rechtien
Date: 09/02/2022
Davis Brin is primed to be the next great quarterback for the Golden Hurricane and I can explain why.
2021 was an interesting season for the Golden Hurricane. A lot of people (including both Ryan and I) had high expectations for how the team would perform last season. However, as is the norm for Tulsa, it was a way more chaotic year that started with a loss to UC Davis, and ended with a win over Old Dominion in the Myrtle Beach Bowl.
While a bowl qualifying season is never a bad thing, it was definitely a frustrating season to watch, especially after a conference title game berth just a year prior. I think the biggest reason for those high expectations was due to Davis Brin’s insane performance in the Thursday night game against Tulane in 2020.
But, before I get into that performance I want to quickly explain a stat that I’ll be using somewhat frequently in this post—Expected Points Added (EPA).
EPA - What is it good for?
What is EPA and why is it a tool worth using? Football box scores have progressed tremendously in regards to the metrics they provide over the years, but the one thing they will never really be able to do is provide the context behind those metrics. Not every play for four yards is worth the same. Down, distance and where you are on the field matters.
Think about this: a four-yard pass on 3rd and 2 at your opponent’s 30 yard line is more valuable than the same four-yard pass on 3rd and 7 from your own 30. EPA is a way to try and quantify the value of these plays by assigning them "expected" point values that they add to a drive.
People smarter than I have built models that assign an expected point value to every spot on the field for every possible down and distance. Since their API is free and has loads of valuable and insightful data I use CFBD's EPA model.
So, let's say as an example that Tulsa just received the opening kickoff and took a knee in the end zone. It would be 1st and 10 from their own 25. Based on the model linked above, the expected points for that drive at the first play would be 0.922.
Knowing this starting expected value allows us to determine how many added points the offense is able to generate on that drive. A touchdown would see the team add 6.078 points (TDs are assigned seven points for the sake of simplicity). A field goal would be 2.078, and any sort of turnover during the drive – interception, fumble, punt – would yield -0.922 points added because you got no points on the drive.
I’ll break that into a table which might be a little easier to follow. Note that the expected points are all the same since it’s just based on the starting field position of the drive.
| Expected Points | Actual Points | EPA | |
|---|---|---|---|
| Touchdown | 0.922 | 7.000 | 6.078 |
| Field Goal | 0.922 | 3.000 | 2.078 |
| Turnover | 0.922 | 0.000 | -0.922 |
We can take this idea a step further and calculate the EPA for every individual play based on the expected points of the play before and after it occurs. Simply take the expected points from before the play and subtract that value from the expected points after the play.
Let’s go back to our earlier example:
- It’s 1st and 10 from our own 25-yard line. Current EP on this drive: 0.922
- We run the ball for 5 yards. It’s now 2nd and 5 from our 30. New EP on this drive: 1.017
- To get the EPA of that 5-yard rush we just take [1.017 - 0.922] and get: 0.095.
Not all plays that yield positive yards will increase your expected points. Sticking with our example:
- If we only got four yards and are now faced with a 2nd and 6 at the 29-yard line, our new EP for this drive: 0.808
- Rushing for one fewer yard results in a drop in EP by: 0.114 [0.922 - 0.808].
As you can see these numbers are all pretty small, which is partially a result of selecting a relatively easy example. However, the average play in all of college football only averages ~0.21 EPA, so my example isn’t an outlier by any means. The advantage of using this more standardized value is that it levels the playing field in terms of comparisons. It’s a stat that allows you to make comparisons across teams as well as seasons - which is incredibly useful in college football due to the countless number of different systems that have been and still are being used across the sport.
And one last note on EPA. It’s not perfect and different sources of data use different models. So don’t focus on the absolute value of the numbers but more the trends and comparisons that are the most important parts to focus on.
Back to Brin
Now, with that incredibly long tangent out of the way, let’s go back to the night of November 19th, 2020 against Tulane. After injuries knocked both Zach Smith and Seth Boomer out of the game, third-string quarterback Davis Brin enters looking at a 14-0 deficit with just over a quarter left to play.
And he responded with the type of performance Tulsa hadn’t seen—at least not with any regularity—since the 2016 season. Brin accounted for 266 yards, three touchdowns (including one with his legs) and led Tulsa to a stunning comeback over the Green Wave.
In that single quarter, on 31 combined passing and running plays, Davis Brin averaged an astronomical 0.561 EPA. In all of college football in 2020 there were only three quarterbacks with a higher EPA average: Dustin Crum (Kent State), Jack Sears (Boise State) and Mac Jones (Alabama). The top two QBs, including the AAC Offensive Player of the Year, Desmond Ridder and Dillon Gabriel were under 0.50.
In that single quarter, Davis Brin accounted for ~24%(!) of Tulsa’s total passing EPA in 2020. The excitement for 2021 was off the charts. But therein lies the problem. We (ok, maybe it might have just been me) were looking at 16 minutes of unforgettable football and extrapolating way too much from that performance to predict how good he was going to be in 2021 - even with the caveat that it wasn’t going to be as good. Those were unrealistic expectations, and not fair to Brin. So, it’s no surprise that the beginning of last season was a harsh reality check with three losses to start off the season and four in the first five games. But that is not to say Brin had a bad year. Far from it. In the next two sections I’ll walk through his ’21 numbers and explain why I think he’s poised to break out this year.
Brin's First Season
To get a general sense of Davis Brin’s 2021 campaign lets just look at his overall stat line:
| Comp | Att | % | Yds | Yds/Att | TDs | INTs |
|---|---|---|---|---|---|---|
| 244 | 411 | 59.4 | 3,269 | 8.0 | 18 | 16 |
The elephant in the room is the 16 interceptions, which led the nation, and the only thing I have to say about that is that some of those went off of receivers hands. And 16 interceptions is the fewest thrown in a normal season–i.e. not 2020–to “lead” the nation in possibly all of college football history (I got bored and stopped looking after 1985). That being said, the biggest obstacle to Davis Brin taking the step I think he’s capable of making is not being able to get the interceptions under control. While watching some film from last year in the process of writing this there were some bad throws. The pick-six against South Florida and a handful against Tulane and Houston. Too often he would stare down his receiver, giving the defense an easy chance to step into his passing lanes.
As far as the other stats go, his 3,269 yards were just outside the top-20 and 8.0 yards per attempt were in the top-50 among qualifying quarterbacks. All in all, Brin had a very average-to-slightly-above-average season. And that tracks with our season, it was a slightly above average season that ended 7–6 with a win over a middle of the road C-USA team.
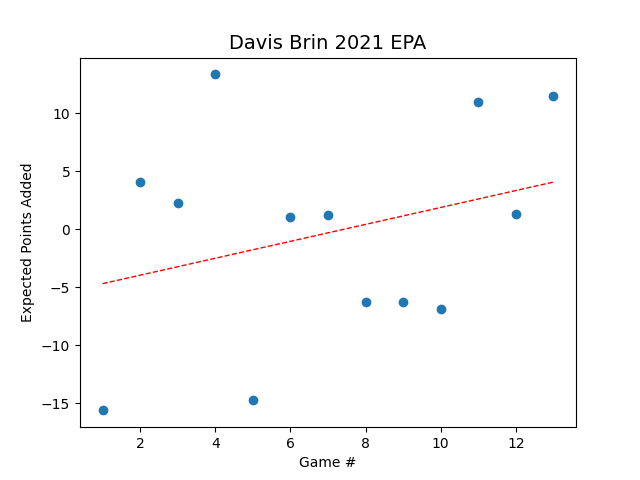
Now let’s look at it his 2021 season in terms of EPA. Over 13 games Brin averaged 0.267 EPA per pass attempt (I’m ignoring rushes for now since we don’t have many designed QB runs and sack stats create a lot of noise in the underlying data). Over the course of the season that would account for over 100 total expected points added just by his arm. This is the highest EPA in the last five years—and Brin threw fewer passes than Smith did in 2019 (even with an extra game played).
| Average EPA / Pass | Total Passing EPA | |
|---|---|---|
| Davis Brin - 2021 | 0.267 | 109.7 |
| Zach Smith - 2019 | 0.247 | 106.0 |
| Zach Smith - 2020 | 0.193 | 53.6* |
| Skipper / Boomer - 2018 | 0.105 | 36.2 |
| President / Skipper - 2017 | 0.072 | 29.2 |
*COVID shortened season
The best part about Brin’s numbers is that after a start that featured some extreme highs (Oklahoma State and Ohio State) and bad lows (UC Davis and Houston) he got more consistent as the season wore on and saw his EPA / game trend up. And that passes the gut check when I think about last season. Down the stretch TU won three straight to get to a bowl game and then dominated Old Dominion in that game as well. Looking at some EPA values across the season you can see the boom and bust nature of the early games and then it levels out a bit towards the back half of the season.
If we split the season up it becomes a little more clear how Brin improved, while also removing some of that boom and bust style. Here's his EPA from the first six games:
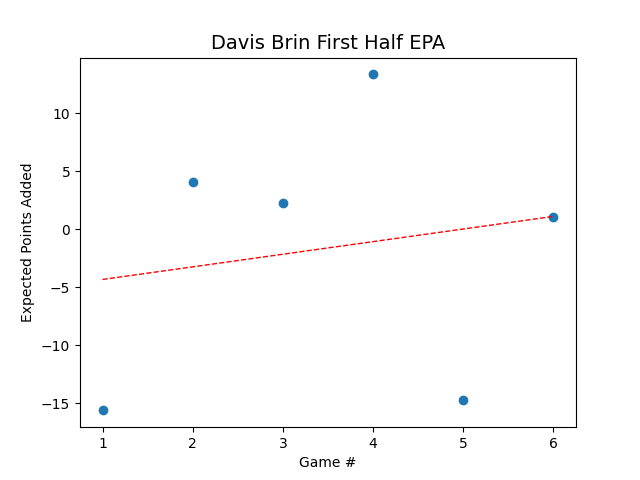
Of those six games, he had two (UC Davis and Houston) with an EPA worse than -15, meaning he cost us points due to turnovers and/or just not playing very well. And on the flip side, his best game of the season came against Ohio State and he had an EPA just under 15. Unfortunately that performance wasn't enough since we still ended up losing that one. And as the trendline (the red dashed line) indicates, he was improving over those six games.
Turning our attention to the final seven games, we can see that the lows aren't quite as low and there is more consistency betwen games.
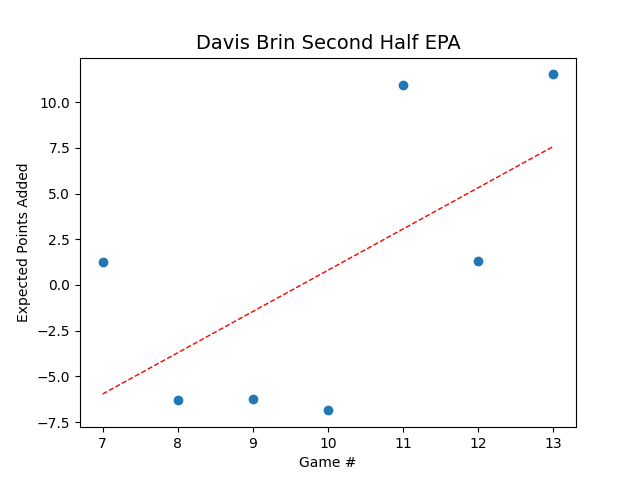
His performances with EPAs under zero (Navy, Cincy and Tulane) combined were barely worse than just the Houston game in terms of total EPA. So his bad games were not as bad–-and we won one of those games with a chance to play spoiler at Cincinatti. Additionally, the trend on the back half shows a much steeper improvement from game seven to thirteen. This gives me confidence that Davis Brin had a very normal 'first-year starter' season and makes me excited to see his progression in year two.
I mean, the last time Tulsa had a first-year starter throw 16+ interceptions, with just over 3,000 yards of offense - it worked out pretty well.
Dane Evans' First Season
Of course, I'm talking about Dane Evans. The TU quarterback from 2013-2016 who set AAC records and led Tulsa to a 10-3 season in his senior season. Dane Evans is a name that carries a lot of weight around Tulsa because of the success that he and the team had during his tenure. But, what you may not recall right off the bat is that his first full season as a starter wasn't anything special. Let's look at his 2014 stat line.
| Comp | Att | % | Yds | Yds/Att | TDs | INTs |
|---|---|---|---|---|---|---|
| 256 | 462 | 55.4 | 3,102 | 6.7 | 23 | 17 |
The only stat Evans led Brin in was touchdowns with 23 to 18. Now, there is the caveat that 2014 was the final year with Bill Blankenship as head coach and he ran a different style compared to what Montgomery would bring the next season so its not exactly an apples to apples comparison. But that's why I spent so much time explaining EPA--so that I can make some sort of comparison.
Let's take another look at the Average EPA table, but adding Evans in this time.
| Average EPA / Pass | Total Passing EPA | |
|---|---|---|
| Dane Evans - 2015 | 0.361 | 175.1 |
| Dane Evans - 2016 | 0.341 | 148.3 |
| Davis Brin - 2021 | 0.267 | 109.7 |
| Zach Smith - 2019 | 0.247 | 106.0 |
| Zach Smith - 2020 | 0.193 | 53.6* |
| Dane Evans - 2014 | 0.160 | 73.9 |
| Skipper / Boomer - 2018 | 0.105 | 36.2 |
| President / Skipper - 2017 | 0.072 | 29.2 |
*COVID shortened season
Evans' 0.160 EPA in 2014 was well below the 0.196 average for all QBs in college football in 2014. Whereas Brin's 0.267 in 2021 was just above the average of 0.264 for the season. And against a more competitive schedule to boot.
According to Sports Reference's Strength of Schedule (SOS) rating, in 2014 Tulsa had a SOS of -2.56 which was 84th in the country and they finished 3-9. And in 2021 the SOS was -0.29 which was 68th in the country. By that metric, Brin was putting up better numbers against a harder schedule than Evans and finished 7-6.
Brin played Oklahoma State (who almost won the Big 12 and made the playoff), Ohio State (winners of the Rose Bowl), and Cincinatti (the first non-Power 5 program to make the playoff). And for the most part he kept Tulsa in those games.
The best team Tulsa played in 2014 was an Oklahoma team that came into the season ranked fourth, but finished with a very meh season at 8-5.
In his second full year as a starter, Evans exploded - and he became the all-time leader in passing yards in the American.
| Comp | Att | % | Yds | Yds/Att | TDs | INTs |
|---|---|---|---|---|---|---|
| 305 | 485 | 62.9 | 4,332 | 8.9 | 25 | 8 |
Most of those stats led the American in 2015, and Tulsa went from scoring 24.7 points per game to 37.2. That was an exciting year for Tulsa - capped off by a bowl game against Virginia Tech that featured four touchdowns within the first three and a half minutes.
The momentum from that season carried forward to 2016 as Tulsa became the first team in college football history to have a 3,000-yard passer (Dane Evans), two 1,000-yard receivers (Keevan Lucas & Josh Atkinson), and two 1,000-yard rushers (D'Angelo Brewer & James Flanders).
When Monty finds his QB he can win. And comparing Brin's first full season to Evans' first, it looks like he's found his man.